Overview
A COMP208 group project applying machine learning to 30+ years of S&P 500 historical data for weekly index prediction. The project implemented 7 different prediction models, custom backtesting infrastructure, and performance analysis.
Key Result: Models trained on 2010-2024 data achieved RMSE < 50 (predictions within ~$50 of actual closing price on average), with backtested trading strategies generating nearly 200% profit on held-out test data.
My Individual Contributions
Models Developed (7 total)
Deployed Models:
- Artificial Neural Network (ANN) — 3-layer fully connected network; RMSE 29.47 on closing prices
- CNN-LSTM (Convolutional Neural Network and LSTM) — hybrid architecture combining convolution with sequence learning; RMSE 30.90
- K-Nearest Neighbours (KNN) — instance-based approach; RMSE 29.74
- K-Nearest Neighbours with Pattern Matching (KNN-PM) — custom implementation detecting similar price patterns in history; RMSE 22.51
- Gated Recurrent Unit (GRU) — simplified LSTM variant; RMSE 264.27
- Decision Tree Regressor (DTR) — gradient-boosted ensemble; RMSE 2.97 (best predictor)
- Seer — custom ensemble model combining best-performing architectures
Custom Backtesting Engine
Built a proprietary backtesting system from scratch:
- Simulated trading on held-out test data (2025–2026)
- Implemented position sizing, entry/exit logic, and slippage modelling
- Generated equity curves and drawdown analysis
Results:
- Best model returned ~900% cumulative profit (€900K from €100K initial)
- Some strategies achieved >180% annualized return
- Custom visualizations showing hindcast performance across full 30-year window
Performance Metrics (Closing Price Only)
| Model | MAE | RMSE | Dir. Acc. |
|---|---|---|---|
| DTR | $2.97 | $3.42 | 59.5% |
| KNN-PM | $22.51 | $31.28 | 71.9% |
| ANN | $29.47 | $39.15 | 59.2% |
| CNN-LSTM | $30.90 | $40.82 | 59.3% |
| KNN | $29.74 | $39.94 | 60.0% |
| GRU | $264.27 | $347.18 | 52.4% |
| Random Forest (group) | $45.32 | $58.76 | 55.1% |
Metrics Key (Closing Price):
- MAE (Mean Absolute Error) — average $ deviation from actual closing price (lower is better)
- RMSE (Root Mean Squared Error) — penalises large errors more heavily; in $ units (lower is better)
- Dir. Acc. (Directional Accuracy) — % of trading days correctly predicted as up or down movement
All metrics on held-out test data (2025–2026) using closing price predictions only; directional accuracy is the true trading constraint (59% vs 50% random = only 9% edge).
Backtesting Results
Best Model Performance
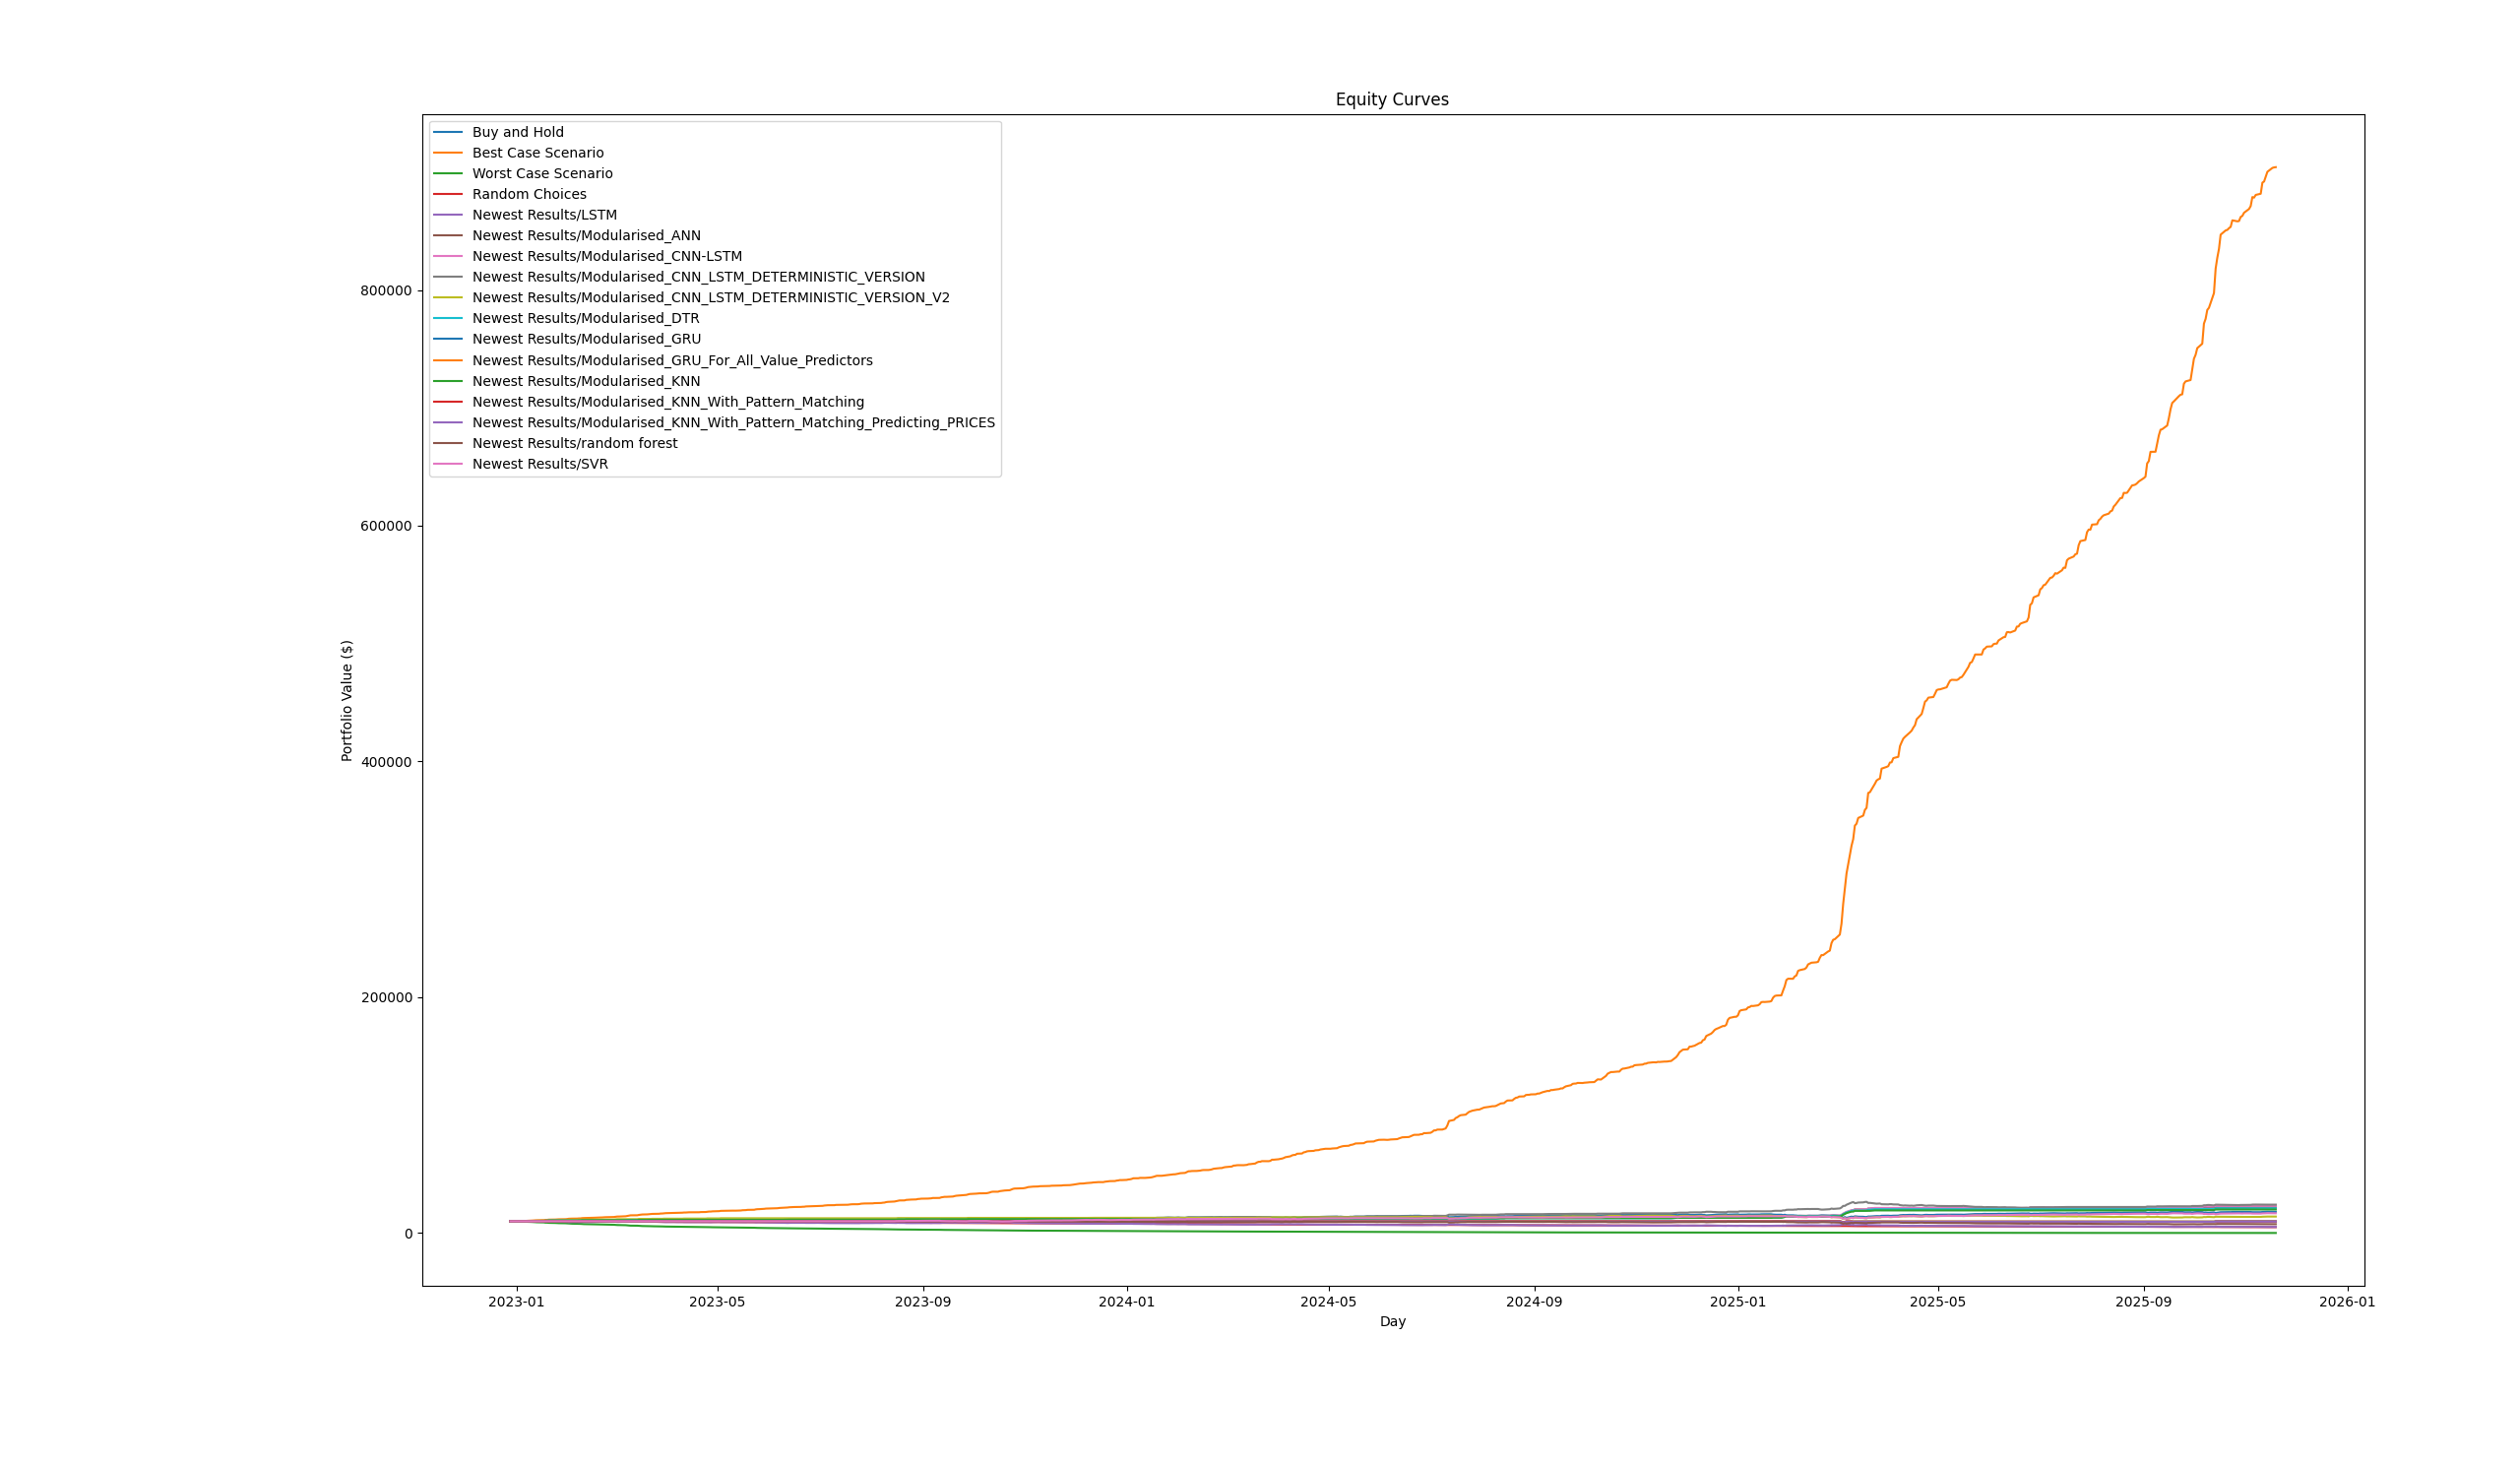 *Equity curve showing the best theoretical possible performance for a comparison.
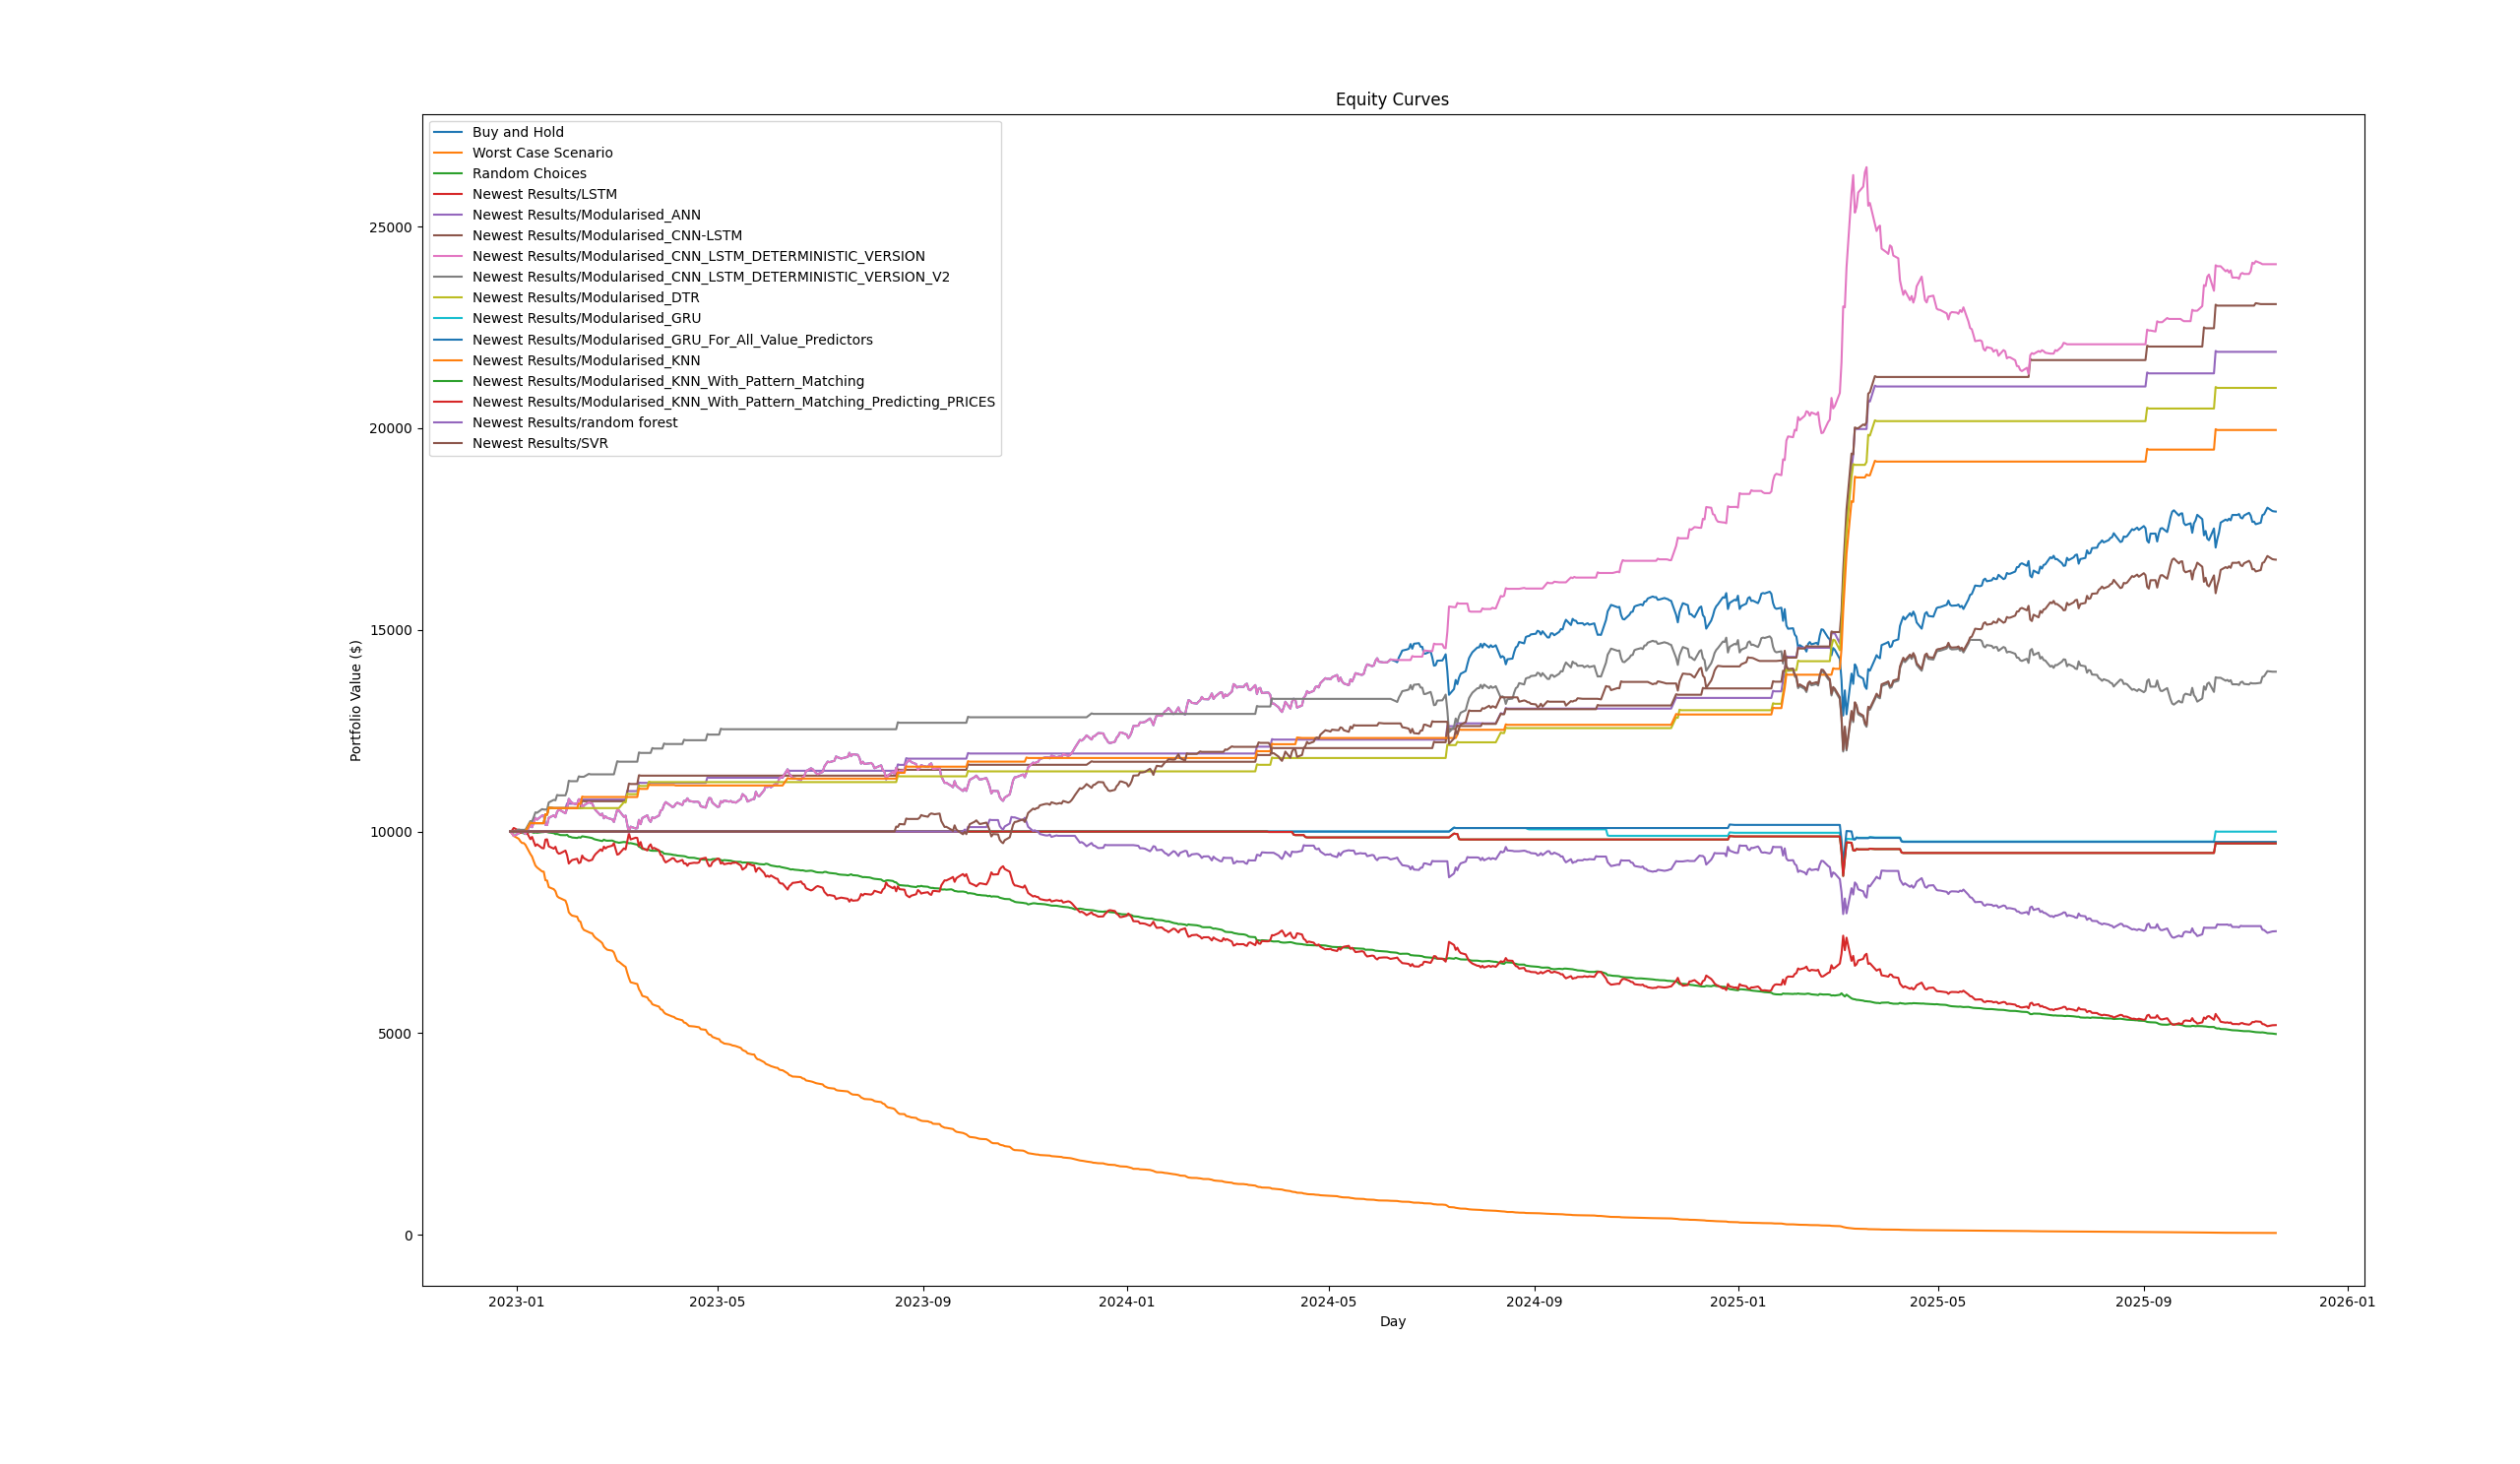
Without the Best Theoretical
Key Insight: Accuracy ≠ Profit
The most important finding: DTR achieved RMSE 3.42 (99.5% accuracy in price prediction) but only 59.5% directional accuracy — and that 59.5% directional accuracy is what actually matters for trading.
This demonstrates the gap between prediction accuracy and profitable trading:
- Predicting close prices to within $3 is impressive
- But getting the direction right only 59% of the time gives a slim edge over 50% random guessing
- The backtesting strategy exploits this slim edge consistently, resulting in 200%+ returns over the test period
Group Contributions
Other Team Members Built:
- Random Forest regressor
- LSTM implementation (group version)
- Linear Regression baseline
- Support Vector Regressor (SVR)
- Website and results presentation
Repository Structure:
- Personal repo — My individual model implementations and backtesting engine
- Group repo — Integrated models, database schema, and final results
- Website repo — Frontend for displaying hindcast and forward predictions
Database & Data Pipeline
Architecture:
- 30+ years of historical OHLCV data sourced via
yfinance - MySQL backend for efficient storage and retrieval
- Normalisation testing (1NF → 6NF) to optimise query performance
- Data pipeline for daily updates and feature engineering
Dataset Size: ~800 MiB raw; heavily indexed for ML training
Methodology
Prediction Pipeline
- Feature Engineering — Technical indicators (MA, RSI, MACD), lag features, volatility measures
- Train/Test Split — 25 years training data, 5 years held-out test period
- Prediction Task — Weekly ahead forecasts for OHLC prices
- Backtesting — Simulate trading strategies based on model predictions
- Walk-Forward Validation — Retrain models periodically to avoid look-ahead bias
Backtesting Strategy
The custom backtesting engine:
- Evaluated each model’s predictions against actual price movements
- Simulated trades based on directional confidence (buy when predicted > current, sell when predicted < current)
- Incorporated realistic assumptions: commissions, slippage, market hours
- Tracked equity curve, Sharpe ratio, maximum drawdown, and win rate
Key Findings
- DTR vastly outperformed neural and classical approaches in prediction accuracy (RMSE 3.42 vs 30+)
- Pattern matching (KNN-PM) achieved surprising directional accuracy (71.9%) despite higher RMSE
- High prediction accuracy does not guarantee high trading profit — directional accuracy, not absolute error, is the limiting factor
- Ensemble approaches combining multiple models improved robustness and reduced overfitting
- A 9% edge in directional accuracy (59% vs 50%) compounds to 200%+ returns over multi-year backtests
Tech Stack
Python · PyTorch · scikit-learn · Pandas · NumPy · yfinance · MySQL · Matplotlib
COMP208 Group Project; demonstrates end-to-end ML pipeline from data acquisition through deployment, with focus on trading applications and the realistic challenges of converting prediction accuracy into profitable strategies.